Create and Adjust Custom Views (Dashboard)
You can create and adjust custom views in the Explore section of the HUMAN Dashboard to visualize the traffic data analyzed by each of HUMAN's products. The Explore section's configuration sidebar includes options for choosing which data is included in these views and offers the ability to create and schedule reports based on view data.
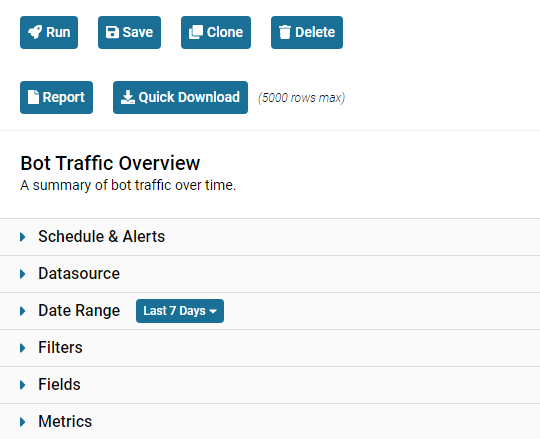
To create a new view, select New Custom View. You can also adjust the parameters of an existing view by selecting that view from the Views menu.
Select Run to fetch the data associated with your view, Report to generate a report file from your view, or Save to save your view for future reference.
You will not be able to schedule recurring reports or generate report files in the Reports page for a view unless you have saved that view. However, you can use the Quick Download button to immediately download a snapshot of your view without generating a file in the Reports page.
If you update or rename an existing custom view, any saved changes will overwrite the old view. Tread carefully—if you overwrite a view, you won't be able to retrieve previous versions of that view.
Name
When creating a new custom view, choose a name that reflects the overall purpose or function of your view. You can also enter a short description with any additional information about your view.
If you'd like to share a custom view with other members of your organization, select the Share this view toggle. Other members of your organization will be able to access this view from the Shared Views menu to edit, clone, and create reports from this view.
Schedules & Alerts
You can create regularly scheduled reports from your view data by selecting the Set Schedule toggle. When this toggle is enabled, new files will appear in the Reports section of the Dashboard according to the following settings:
Repeats: How often HUMAN will generate a report.
Repeats every/on/at: The frequency at which new reports will be generated. The available options correspond to the interval you selected from the Repeats drop-down menu. For example, if you choose to schedule reports on a weekly basis, you can select specific days of the week to generate new reports.
Set Alert: If this toggle is enabled, HUMAN will run reports as scheduled, but new report files will only appear in the Reports section of the Dashboard if those reports contain data based on your selected fields, metrics, and filters. (In other words, if a report contains no data, the empty report file will not be generated.) For more information, see Set Up Dashboard Alerts.
Email Notification: If this toggle is selected, HUMAN will send an email with the corresponding report file attached for each scheduled report. If the Set Alert toggle is also selected, you will only receive email notifications for reports with a nonzero amount of data.
Send To: The email address(es) to which email notifications will be sent.
By default, only certain authorized domains can be added as recipients. If you’d like to send email notifications to an email address whose domain has not yet been approved, please contact a HUMAN representative for assistance.
Datasources
If you're using multiple HUMAN products, you can choose which product's data to include in your view. Additionally, if you're creating a view using BotGuard for Growth Marketing data, you can choose whether to use pageviews or sessions as a base unit.
Certain HUMAN products also let you choose between Transactional data (which lists every recorded event as a discrete data point) or Aggregate data (which highlights general trends and traffic patterns). Some customization options, like filters and metrics, may not be available for Transactional views.
Date Range
You can adjust the time frame of your view by selecting one of several preset date ranges or by selecting a custom date range on the calendar.
Filters
Filters are only available for Aggregate data.
You can create filters based on the fields and metrics associated with your view. These filters can help you narrow down large datasets by only including data that meets certain criteria.
To add a new filter, select the Filters button and toggle the checkbox next to the name of each field or metric you would like to include or exclude. Select Add to save your changes, or Cancel to revert to your previous configuration.
Each filter consists of an Operator drop-down menu and a text field to enter your filter condition(s). For example, if you’d like to exclude traffic data from Windows users, create a filter from the OS Name field, select the operator "Is not," and enter Windows in the text field. For field-based filters, you can also add multiple constraints by entering multiple values separated by semicolons (e.g., Windows; Linux; Mac).
To create multiple filters from the same field or metric, select Add constraint. This will add a new Operator menu and text field; the way you configure this new filter will not affect any existing filters created from that field or metric.
Fields
You can choose which fields are included in your view. Although the specific fields available vary between solutions, each field offers a unique way to break down your data into distinct categories—for example, you may wish to group data by user platform, campaign ID, or device type. You must include at least one field in your view, but you can add as many additional fields as you see fit.
To add or remove fields, toggle the checkbox next to the name of each field you would like to include or exclude, or toggle the checkbox next to the name of a category to include or exclude all metrics in that category.
Traffic visualization charts are only available if you selected a single field for your view, since this field will be used to populate the chart’s data. If you include more than one field in your view, the associated chart will be blank.
Metrics
Metrics are only available for Aggregate data.
You can choose which metrics are included in your view. Metrics provide further insight into the selected field(s)—for example, you may wish to measure levels of SIVT (your metric) across different platform types (your field). Like fields, the specific metrics available vary between solutions.
By default, new views include the metrics from each solution’s Summary category. To add or remove metrics, toggle the checkbox next to the name of each metric you would like to include or exclude, or toggle the checkbox next to the name of a category to include or exclude all metrics in that category.